It is an interesting idea to generate colorful images using or music. In both areas Clojure seems to be quite attractive. Not having explored the music side, I did find the idea of creating images fun and inspiring. It also shows us something about the functions we are working with, if we learn to read the images right, but that will come or not, depending on the circumstances. It is useful not to be too scared of some mathematics when reading this.
Now the challenge is to create an image on a two dimensional array of points, for example 1000×1000 pixel, with x- and y-coordinates ranging from 0 to 999. Each pixel needs to be colored. While it is very interesting to explore different color models, we can for simplicity assume that we need 3 numbers each ranging from 0 to 255 for the red, green and blue channels. This is how most displays work, more or less. Now the goal is to create something that looks good. And of course is reasonable to program, otherwise we could just color one million points individually using for example GIMP, but a million is a lot.
Now we can apply any function on x and y and play around with functions like exp, log, sqrt, sin, cos, tan, sec, csc, sinh, … and of course the basic operations +, -, * and /. It turns out that in most cases we do not get interesting images, but experience will show what is promising to explore. I tried to create pictures by keeping the three channels fairly independent, but this did not work so well. It seems that it is better to keep some connection. One approach that actually works quite well is to consider the pair  as a complex number
  and to apply just one complex function on it, again exp, log, sqrt, sin, …. are good building blocks. Now these complex functions have a tendency to grow to infinity somewhere. While real functions can avoid this issue by constraining themselves just to one strait line on the plane, complex functions almost have to go to infinity somewhere. By making the square small enough or by changing the scale we can avoid this, but it imposes quite severe constraints. The Riemann Sphere allows us to map any complex number to a point on the surface of a sphere. With some scaling we can already get to RGB-space and get coordinates that are using, but not exceeding the desired range. There are more ways to visualize complex numbers, but this is a possibility worth exploring.
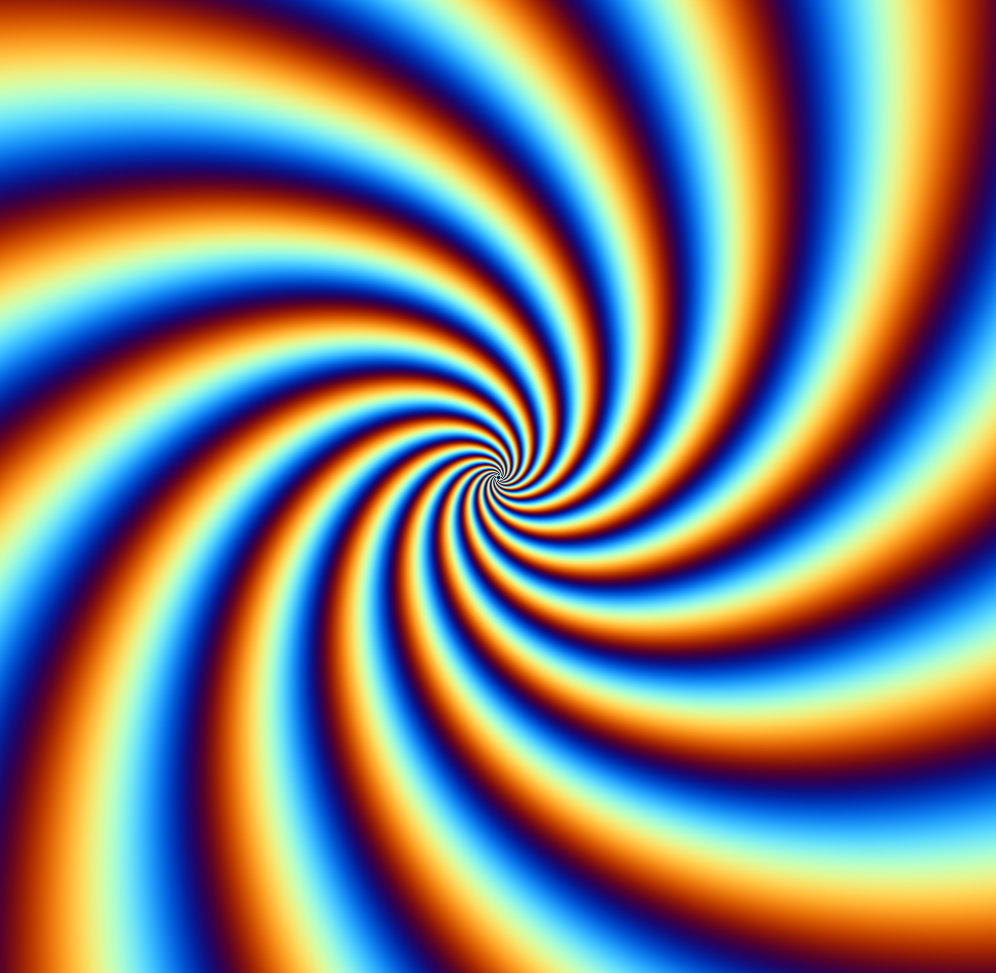
Another way is to just use functions that calculate a real number and to apply a  to it. With some shifting and scaling the values will be between 0 and 255 only and there are nor abrupt changes in color, unless the function we calculated is very steep or very chaotic. Using phase shifts by
  and
and  the three color channels can be served and we get nice rainbow-waves like the following:
Another experiment was to just assume the HSV-model and to calculate the colors from assuming the function is the H-part. But this ended up looking like plastic and I did not like it too much.
An important issue to observe is that functions may end up in exceptions. I wrapped the functions, so that they do not stop the calculation of the image half way through, but instead provide default values in cases where an exceptions occured.
It can also be fun to explore bitwise-functions like bitxor or even functions like the p-adic exponential function, which yields totally different kind of images.
I have put some of the code from my experiments into Github and licensed it with the GPL, so you can use it as a starting point. Others have worked with this as well, for example Clojure Art on Tumblr, Clojure Art Collective on github, another „clojure art“ on github or creative computing with clojure on O’Reilly’s blog.
Enjoy it and learn some Clojure. I sometimes use this when teaching Clojure.

Schreibe einen Kommentar